Contents
- Corporate profile
- Key statistics 2009
- Key features 2009
- Operations at a glance
- FY09 – milestones
- Harmony strategy
- Chairman’s letter
- Chief executive officer’s review
- Review of operations
- Exploration overview
- Mineral resources and ore reserves
- Board of directors
- Executive management
- Corporate governance
- Directors’ report
- Report of the independent auditors (PDF - 37KB)
- Group annual financial statements (PDF - 312KB)
- Company annual financial statements (PDF - 123KB)
- Statement of subsidiary companies (PDF - 48KB)
- Investor relations
- Glossary of terms
- Administrative information
Evander
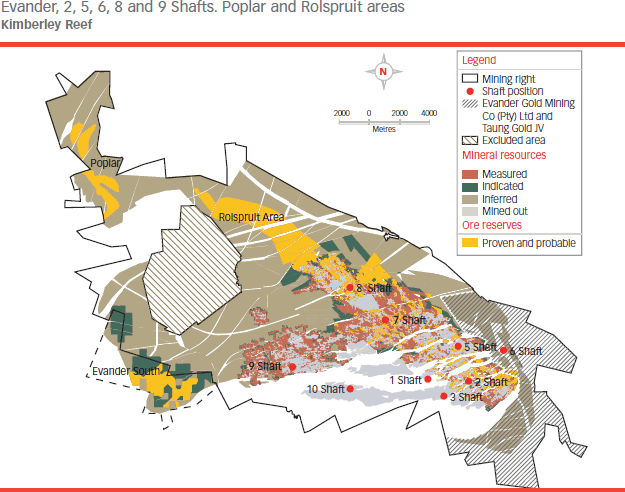
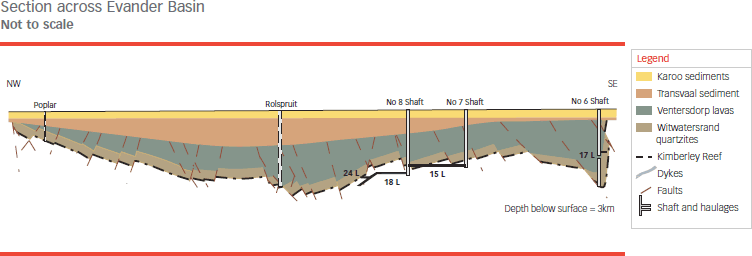
Geology: The Evander Basin is a tectonically preserved sub-basin outside the main Witwatersrand Basin and forms an asymmetric syncline, plunging to the north-east. It is structurally complex with a series of east-north-east striking normal faults. At the south-east margin of the basin, vertically to locally overturned reef is present. The only economic reef horizon exploited in the Evander Basin is the Kimberley Reef. The Intermediate Reef is generally poorly mineralised, except where it erodes the sub-cropping Kimberley Reef in the south and west of the basin.
![Evander operations [Map]](i/evander_ops.gif)


Mineral resources
| Measured | Indicated | Inferred | Total | |||||||||||||
|---|---|---|---|---|---|---|---|---|---|---|---|---|---|---|---|---|
| Operations | Tonnes (Mt) |
g/t | Gold (000kg) |
Gold (000oz) | Tonnes (Mt) |
g/t | Gold (000kg) |
Gold (000oz) | Tonnes (Mt) |
g/t | Gold (000kg) |
Gold (000oz) | Tonnes (Mt) |
g/t | Gold (000kg) | Gold (000oz) |
| Underground | ||||||||||||||||
| Evander 2/5 | 7.7 | 10.62 | 81 | 2 618 | 2.0 | 10.47 | 21 | 678 | 6.5 | 11.36 | 75 | 2 386 | 16.2 | 10.90 | 177 | 5 682 |
| Evander 7 | 1.9 | 12.08 | 23 | 754 | 0.1 | 9.28 | 1 | 44 | 13.9 | 10.91 | 151 | 4 857 | 15.9 | 11.04 | 175 | 5 655 |
| Evander 8 | 3.7 | 11.96 | 44 | 1 404 | 9.2 | 11.37 | 105 | 3 361 | 14.3 | 11.79 | 169 | 5 424 | 27.2 | 11.67 | 318 | 10 189 |
| Total | 13.3 | 11.20 | 148 | 4 776 | 11.3 | 11.18 | 127 | 4 083 | 34.7 | 11.36 | 395 | 12 667 | 59.3 | 11.29 | 670 | 21 526 |
| Projects – Below Infrastructure | ||||||||||||||||
| Evander South | - | - | - | - | 21.1 | 5.46 | 115 | 3 696 | 33.8 | 3.98 | 135 | 4 326 | 54.9 | 4.55 | 250 | 8 022 |
| Rolspruit | - | - | - | - | 29.1 | 11.59 | 337 | 10 847 | 4.9 | 5.69 | 28 | 902 | 34.0 | 10.74 | 365 | 11 749 |
| Poplar | - | - | - | - | 15.6 | 10.21 | 159 | 5 123 | - | - | - | - | 15.6 | 10.21 | 159 | 5 123 |
| Total | - | - | - | - | 65.8 | 9.30 | 611 | 19 666 | 38.7 | 4.19 | 163 | 5 228 | 104.5 | 7.41 | 774 | 24 894 |
| GRAND TOTAL | 13.3 | 11.20 | 148 | 4 776 | 77.1 | 9.58 | 738 | 23 749 | 73.4 | 7.58 | 558 | 17 895 | 163.8 | 8.81 | 1 444 | 46 420 |
Modifying factors
| Operations | MCF (%) | SW (cm) | MW (cm) | PRF (%) |
| Evander 2/5 | 67 | 143 | 190 | 98 |
| Evander 7 | 85 | 159 | 368 | 97 |
| Evander 8 | 70 | 120 | 181 | 97 |
| Evander South | 88 | 100 | 131 | 97 |
| Rolspruit | 80 | 110 | 129 | 97 |
| Poplar | 80 | 100 | 116 | 97 |
- MCF = Mine call factor
- MW = Milling width
- SW = Stoping width
- PRF = Plant recovery factor
Ore reserves
| Proven | Probable | Total | ||||||||||
|---|---|---|---|---|---|---|---|---|---|---|---|---|
| Operations | Tonnes (Mt) |
g/t | Gold (000kg) |
Gold (000oz) | Tonnes (Mt) |
g/t | Gold (000kg) |
Gold (000oz) | Tonnes (Mt) |
g/t | Gold (000kg) |
Gold (000oz) |
| Underground | ||||||||||||
| Evander 2/5 | 0.8 | 6.35 | 5 | 163 | 0.2 | 6.17 | 1 | 38 | 10 | 6.32 | 6 | 201 |
| Evander 7 | 0.2 | 4.64 | 1 | 27 | 0.0 | 8.48 | 0 | 2 | 0.2 | 4.81 | 1 | 29 |
| Evander 8 | 1.8 | 5.66 | 10 | 332 | 7.0 | 6.21 | 43 | 1 394 | 8.8 | 6.09 | 53 | 1 736 |
| Total | 2.8 | 5.79 | 16 | 522 | 7.2 | 6.21 | 44 | 1 434 | 10.0 | 6.09 | 60 | 1 956 |
| Projects – Below Infrastructure | ||||||||||||
| Evander South | - | - | - | - | 11.5 | 4.80 | 55 | 1 773 | 11.5 | 4.80 | 55 | 1 773 |
| Rolspruit | - | - | - | - | 24.4 | 8.71 | 213 | 6 842 | 24.4 | 8.71 | 213 | 6 842 |
| Poplar | - | - | - | - | 13.5 | 7.45 | 101 | 3 234 | 13.5 | 7.45 | 101 | 3 234 |
| Total | - | - | - | - | 49.4 | 7.45 | 369 | 11 849 | 49.4 | 7.45 | 369 | 11 849 |
| GRAND TOTAL | 2.8 | 5.79 | 16 | 522 | 56.6 | 7.30 | 413 | 13 283 | 59.4 | 7.22 | 429 | 13 805 |
![Evander 2 and 5: grade tonnage curve (measured and indicated resources) [graph]](i/evander_2_tonnage.gif)
![Evander 7: grade tonnage curve (measured and indicated resources) [graph]](i/evander_7_tonnage.gif)
![Evander 8: grade tonnage curve (measured and indicated resources) [graph]](i/evander_8_tonnage.gif)
Harmony Annual Report 2009

