Contents
- Corporate profile
- Key statistics 2009
- Key features 2009
- Operations at a glance
- FY09 – milestones
- Harmony strategy
- Chairman’s letter
- Chief executive officer’s review
- Review of operations
- Exploration overview
- Mineral resources and ore reserves
- Board of directors
- Executive management
- Corporate governance
- Directors’ report
- Report of the independent auditors (PDF - 37KB)
- Group annual financial statements (PDF - 312KB)
- Company annual financial statements (PDF - 123KB)
- Statement of subsidiary companies (PDF - 48KB)
- Investor relations
- Glossary of terms
- Administrative information
Elandsrand

![Elandsrand location [SA map]](i/sa_elandsrand.gif)
Description
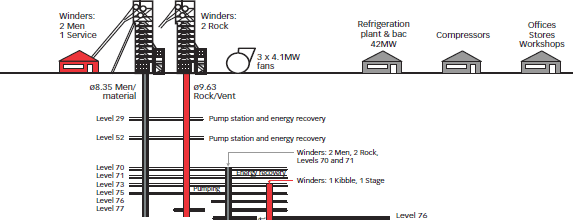
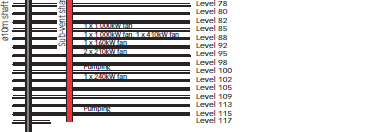
The Elandsrand mine, which is located on the Gauteng-North West Province border, near Carletonville, comprises twin vertical and twin sub-vertical shaft systems. The sub-vertical shafts, which access the deeper parts of the Ventersdorp Contact Reef, have been extended to a depth of 3 600 metres by the Elandsrand deepening project.
Elandsrand, which came into operation in 1978, was purchased from AngloGold Ashanti Limited in FY01.
Mining at Elandsrand is undertaken using conventional mining methods in a sequential grid layout. Work on the project is currently focussed on accessing and opening up areas of the new mine and the development and construction of the necessary support infrastructure. Ore mined at Elandsrand is treated at the Elandsrand Plant.
In FY09, Elandsrand employed 5 283 people – 4 691 employees and 547 contractors.
Mineral resources and ore reserves
At the end of June 2009, Elandsrand reported ore reserves of 7.541 million ounces and mineral resources of 11.556 million ounces. Elandsrand currently has an expected life-of-mine of 28 years. See the mineral resources and ore reserves section (PDF - 100KB) for more detail.
| Elandsrand | Mineral resources | Ore reserves | |||||
| Measured | Indicated | Inferred | Total | Proven | Probable | Total | |
|---|---|---|---|---|---|---|---|
| Oz (000) | 3 313 | 7 812 | 431 | 11 556 | 2 395 | 5 146 | 7 541 |
| Tonnes (Mt) | 11.6 | 28.2 | 1.4 | 41.2 | 11.5 | 26.2 | 37.7 |
| Grade (G/t) | 8.87 | 8.63 | 9.28 | 8.72 | 6.5 | 6.11 | 6.23 |
Safety
Safety received particular attention at Elandsrand in FY09. Three fatal accidents in the first quarter of the year prompted a major senior management intervention. Chief Operating Officer Alwyn Pretorius was seconded to the mine in October 2009 for a period of six months to deal specifically with the issue of safety. As part of this process, operations in working places not regarded as being safe or production-worthy were immediately stopped and made safe, resulting in production losses of 300 kilograms (9 645 ounces) of gold. All stoping production crews underwent safety training on the mine’s Qaphelangozi programme, a behaviour-based safety initiative. This intervention yielded substantial and immediate results, with a progressive improvement in safety performance, workplace conditions and production buildup having been achieved by year-end.
In total there were five fatal accidents in FY09, as compared to four fatalities in three accidents in FY08. No fatal accidents were experienced in the fourth quarter. While the FIFR for the year was unchanged at 0.36 per million hours worked, the LTIFR continued to improve to 12.67 per million hours worked, and from 20.01 in the first quarter to 5.84 in the fourth quarter.
![Elandsrand FIFR (per million hours worked) [graph]](i/ela_fifr.gif)
![Elandsrand LTIFR (per million hours worked) [graph]](i/ela_ltifr.gif)
Elandsrand key statistics:
| Unit | FY09 | FY08 | FY07 | |
|---|---|---|---|---|
| Production | ||||
| Volumes milled | 000 t (metric) | 962 | 890 | 1 013 |
| 000 t (imperial) | 1 061 | 981 | 1 117 | |
| Gold produced | kg | 5 422 | 5 108 | 6 078 |
| oz | 174 321 | 164 215 | 195 412 | |
| Average grade | g/t | 5.64 | 5.74 | 6.00 |
| oz/t | 0.164 | 0.167 | 0.175 | |
| Financial | ||||
| Revenue | R million | 1 422 | 964 | 895 |
| US$ million | 158 | 133 | 124 | |
| Cash costs | R/kg | 191 097 | 152 611 | 123 705 |
| US$/oz | 660 | 652 | 535 | |
| Cash operating profit | R million | 366 | 213 | 157 |
| US$ million | 41 | 30 | 21 | |
| Capital expenditure | R million | 422 | 318 | 238 |
| US$ million | 47 | 44 | 33 |
Elandsrand key quarterly indicators: FY09
![Tonnes (000) [graph]](i/ela_ton.gif)
![Grade (g/t) [graph]](i/ela_grade.gif)
![Gold produced (kg) [graph]](i/ela_gold.gif)
![Cash costs (R/kg) [graph]](i/ela_cost.gif)

The year in review
Elandsrand’s poor safety performance in the first half of FY09 (see above) marred the ramp-up profile of the new mine. Although volumes were higher than in FY08 at 962 000 tonnes, they were significantly lower than planned as a result of accidents, section 54 notices issued by the DMR following these accidents and revisions to mine plans undertaken so as to improve safety performance in a sustainable manner (see above). A steady improvement was achieved in the third and fourth quarters in both volumes and grade.
The average grade achieved was marginally lower year-on-year, declining from 5.74 g/t in FY08 to 5.64 g/t in FY09, as a result of the lower face grade mined. The disciplined approach to mining resulted in a much improved Mine Call Factor (MCF) – above 90% in the fourth quarter.
Gold production was higher, up by 6% at 5 422 kilograms (174 321 ounces), than in FY08, but again far lower than planned.
Cash costs too were higher than anticipated as a result of lower-than-planned production, higher electricity tariffs, labour costs and consumables. Cash costs were 191 097/kg, or US$660/oz. Elandsrand’s cash operating profit was significantly higher, at R366 million (US$41 million) on the back of a higher revenue of R1 422 million (US$158 million).
Outlook*
A conservative build-up in production is expected at Elandsrand in line with the life-of-mine plan. Tonnes milled should rise to 1 100 000 tonnes in FY10, at an average grade of 6 g/t. Grade should progressively increase as the mine reaches full production and progressively more mining takes place in the western high-grade facies where the Elsburg Reef sub-outcrops against the Ventersdorp Contact Reef, causing localised enrichment.
Total capital expenditure** planned for FY10 is R513 million (US$66 million) – R263 million (US$34 million) on on-going development, R40 million (US$5 million) on major equipment maintenance and R93 million (US$12 million) on other shaft capital. The balance of R117 million (US$15 million) is planned for the Elandsrand New Mine project.
* Please refer to the forward-looking statements (PDF - 54KB)
** June 2009 money terms. The exchange rate as at 30 June 2009 of R7.72/US$ has been used for all forward-looking conversions.
![Elandsrand: Five-year production profile [graph]](i/ela_fivep.gif)
Elandsrand New Mine Project
Good progress continued to be made with the development and the build-up of production on the Elandsrand new mine project. The winder and headgear for the No 3 backfill shaft were installed and commissioned in May 2009 and sinking started. This shaft will supply feed and return chilled water to 109 and 113 levels. By year-end both 22 kV transformers had been installed and commissioned at 100 level, as had two of eight bulk air coolers. Commissioning of the second settler dam will begin once the dam wall and suction piping on 115 level has been completed. Progress was also made with the installation of the refrigeration plant pipes and the ventilation system.


Commissioning of the pump station at 115 level, scheduled for the end of FY09, was delayed owing to leaks in the No 1 settler dam. Access development on 113 level was completed in February 2009.
Future milestones include:
- completion of first raise on 109 level in September 2009;
- commencement of ledging on 109 level in October 2009;
- 113 level reaches reef in July 2009;
- first raise on 113 level in March 2011; and
- ledging commences on 113 level in June 2011.
Key statistics
| First production | October 2003 |
| Full production | July 2013 |
| Forecast annual peak production (FY13 to FY21) | 9 651 kg; 310 000 oz |
| Capital expenditure | R1 098 million (US$140 million) R940 million spent to date |
| Expected life-of-mine | 28 years to 2037 |
| Average reserve head grade | 6.27 g/t |
| Life-of-mine ounces | 7.39 million |
![Elandsrand New Mine Project capex (R million) [graph]](i/ela_capex.gif)

