
Resources and reserves
MINERAL RESOURCES AND RESERVES – A SUMMARY
Harmony’s statement of Mineral Resources and Mineral Reserves as at 30 June 2014 is produced in accordance with the South African Code for the Reporting of Mineral Resources and Mineral Reserves (SAMREC) and the Australasian Code for Reporting of Exploration Results, Mineral Resources and Ore Reserves (JORC).
The company’s attributable gold equivalent mineral resources are declared as 133.8Moz as at 30 June 2014, a 9.4% decrease year-on-year from the 147.7Moz declared on 30 June 2013. This 9.4% decrease collectively represents depletion during the year and geology – and scope-related changes. The gold resource ounces in South Africa represent 69%, while the Papua New Guinea gold and gold equivalent ounces represent 31% of Harmony’s total gold equivalent resources as at 30 June 2014.
As at 30 June 2014, Harmony’s attributable gold equivalent mineral reserves amounted to 49.5Moz of gold, a 3.9% decrease from the 51.5Moz declared on 30 June 2013. The 3.9% decrease collectively represents depletion during the year, a change in reserves from surface sources together with some scope changes at some of the underground operations. The gold reserve ounces in South Africa represent 57% while the Papua New Guinea gold and gold equivalent ounces represent 43% of Harmony’s total mineral reserves as at 30 June 2014.
Mineral resources are reported inclusive of mineral reserves. We use certain terms in this report such as ‘measured’, ‘indicated’ and ‘inferred’ resources, which the United States’ Securities Exchange Commission guidelines the strictly prohibit US-registered companies from including in their filings with the sec. US investors are advised to consider closely the disclosure in our Form 20-F.
ASSUMPTIONS
In converting the mineral resources to mineral reserves, the following commodity prices and exchange rates were applied:
- A gold price of US$1 300/oz
- An exchange rate of US$/ZAR10.17
- The above parameters resulted in a rand gold price of R425 000/kg for the South African assets
- The Hidden Valley mine and Wafi-Golpu project in the Morobe Mining Joint Venture used commodity prices of US$1 250/oz Au, US$21/oz Ag, US$15/lb Mo and US$3.10/lb Cu at an exchange rate of A$0.90 per US$
- Gold equivalent ounces are calculated assuming US$1 400/oz Au, US$3.10/lb Cu and US$23.00/oz Ag, and assuming a 100% recovery for all metals. These are the same assumptions as those used in the 2012 pre-feasibility study for the calculation of gold equivalent ounces
AUDITING
Harmony’s South African mineral resources and mineral reserves have been comprehensively audited by a team of internal competent persons that functions independently of the operating units. The internal audit team verifies compliance with the Harmony code of resource blocking, valuation, resource classification, cut-off calculations, development of life-of-mine plans and SAMREC compliant statements from each operation and project which supports Harmony’s annual mineral resources and mineral reserves declaration. This audit process is specifically designed to comply with the requirements of internationally recognised procedures and standards such as:
- The South African Code for the Reporting of Mineral Resources and Mineral Reserves (SAMREC)
- Industry Guide 7 of the Securities and Exchange Commission
- Sarbanes-Oxley requirements
- The Australasian Code for Reporting of Exploration Results, Mineral Resources and Ore Reserves (JORC) which complies with SAMREC
Harmony’s South African Mineral Resources were reviewed and audited by SRK Consulting Engineers and Scientists for compliance with SAMREC. The Golpu Mineral Resource was audited by AMC Consultants Pty Ltd for compliance with the standards set out in JORC.
COMPETENT PERSON’S DECLARATION
In South Africa, Harmony employs an ore reserve manager at each of its operations who takes responsibility for the compilation and reporting of mineral resources and mineral reserves at their operation. In Papua New Guinea, competent persons are appointed for the mineral resources and mineral reserves for specific projects and operations.
The mineral resources and mineral reserves in this report are based on information compiled by the following competent persons:
- Resources and reserves South Africa:
Jaco Boshoff, BSc (Hons), MSc, MBA, Pr. Sci. Nat, who has 19 years’ relevant experience and is registered with the South African Council for Natural Scientific Professions (SACNASP) and a member of the South African Institute of Mining and Metallurgy (SAIMM).
- Resources and reserves Papua New Guinea:
Gregory Job, BSc, MSc, who has 26 years’ relevant experience and is a member of the Australian Institute of Mining and Metallurgy (AusIMM).
Mr Boshoff and Mr Job are full-time employees of Harmony Gold Mining Company Limited. These competent persons consent to the inclusion in the report of the matters based on the information in the form and context in which it appears.
Jaco Boshoff
23 October 2014
Greg Job
23 October 2014
RECONCILIATION FY14/FY13
MINERAL RESOURCES
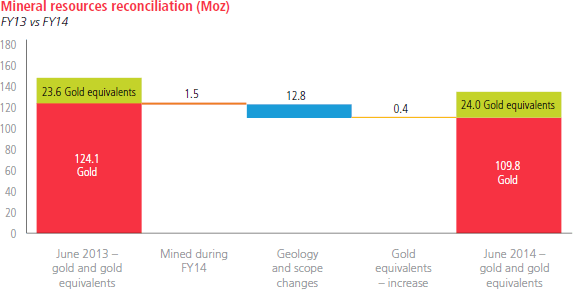
As at 30 June 2014, attributable gold equivalent mineral resources were 133.8Moz, down from 147.7Moz in June 2013. The following table and graph show the year-on-year reconciliation of the mineral resources.
| Gold and gold equivalent mineral resources reconciliation | Tonnes | Moz |
|---|---|---|
| June 2013 – gold and gold equivalents | 4 594 | 147.7 |
| Reductions | ||
| Mined during FY14 | (47) | (1.5) |
| Geology and scope changes | (398) | (12.8) |
| Increases | ||
| Gold equivalents | 12 | 0.4 |
| June 2014 – gold and gold equivalents | 4 161 | 133.8 |
MINERAL RESERVES
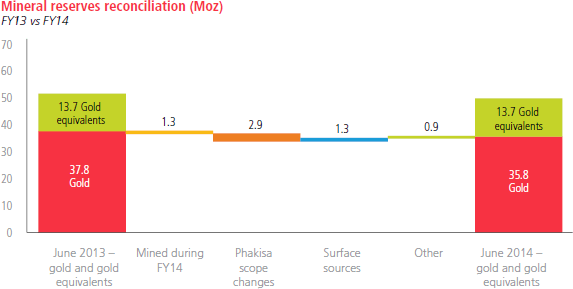
As at 30 June 2014, Harmony’s attributable gold equivalent mineral reserves were 49.5Moz, down from 51.5Moz. The year-on-year mineral reserves reconciliation is shown below.
| Gold and gold equivalent mineral reserves reconciliation | Tonnes | Moz |
|---|---|---|
| June 2013 – gold and gold equivalents | 1 601 | 51.5 |
| Reductions | ||
| Mined during FY14 | (40) | (1.3) |
| Phakisa scope changes | (89) | (2.9) |
| Increases | ||
| Surface sources | 39 | 1.3 |
| Other | 28 | 0.9 |
| June 2014 – gold and gold equivalents | 1 539 | 49.5 |
Mineral resources statement
GOLD |
Measured resources | Indicated resources | Inferred resources | Total mineral resources | ||||||||
| Tonnes (Mt) |
Grade (g/t) |
Gold (000oz) |
Tonnes (Mt) |
Grade (g/t) |
Gold (000oz) |
Tonnes (Mt) |
Grade (g/t) |
Gold (000oz) |
Tonnes (Mt) |
Grade (g/t) |
Gold (000oz) |
|
|---|---|---|---|---|---|---|---|---|---|---|---|---|
South Africa underground | ||||||||||||
| Free State | ||||||||||||
| Gold | ||||||||||||
| Bambanani | 1.9 | 16.40 | 981 | – | – | – | – | – | – | 1.9 | 16.40 | 981 |
| Joel | 4.7 | 7.83 | 1 188 | 7.1 | 8.39 | 1 916 | 1.0 | 7.12 | 221 | 12.8 | 8.09 | 3 325 |
| Masimong | 9.8 | 8.11 | 2 559 | 5.9 | 7.33 | 1 394 | 52.8 | 5.92 | 10 050 | 68.5 | 6.36 | 14 003 |
| Phakisa | 7.0 | 9.54 | 2 144 | 13.8 | 12.26 | 5 459 | 27.6 | 8.32 | 7 388 | 48.5 | 9.62 | 14 991 |
| Target 1 | 8.6 | 7.30 | 2 013 | 9.7 | 7.71 | 2 415 | 2.0 | 5.36 | 340 | 20.3 | 7.31 | 4 768 |
| Target 2 | 0.05 | 14.00 | 20 | 0.1 | 15.52 | 67 | – | – | – | 0.2 | 15.14 | 87 |
| Target 3 | 8.2 | 8.92 | 2 399 | 8.0 | 8.02 | 2 069 | 3.7 | 6.23 | 739 | 19.9 | 8.06 | 5 157 |
| Freddies 9 | – | – | – | 6.0 | 10.61 | 2 045 | 29.6 | 8.09 | 7 690 | 35.6 | 8.51 | 9 735 |
| Tshepong | 19.3 | 11.27 | 7 013 | 3.5 | 10.67 | 1 185 | 8.1 | 8.59 | 2 243 | 30.9 | 10.50 | 10 441 |
| Unisel | 7.9 | 6.86 | 1 746 | 5.1 | 7.69 | 1 272 | 5.1 | 7.30 | 1 188 | 18.1 | 7.22 | 4 200 |
| Total Free State underground | 67.4 | 9.23 | 20 007 | 59.4 | 9.34 | 17 822 | 129.8 | 7.16 | 29 859 | 256.6 | 8.21 | 67 688 |
| West Rand | ||||||||||||
| Doornkop South Reef | 3.1 | 7.75 | 774 | 5.7 | 8.09 | 1 495 | 22.0 | 6.24 | 4 411 | 30.8 | 6.74 | 6 680 |
| Kusasalethu Main Reef | – | – | – | – | – | – | 0.2 | 6.94 | 54 | 0.2 | 6.94 | 54 |
| Total | 3.1 | 7.75 | 774 | 5.7 | 8.09 | 1 495 | 22.2 | 6.25 | 4 465 | 31.1 | 6.74 | 6 734 |
| Kusasalethu | 7.1 | 10.75 | 2 461 | 18.3 | 9.32 | 5 491 | 3.2 | 9.16 | 938 | 28.6 | 9.66 | 8 890 |
| Total West Rand | 10.2 | 9.84 | 3 235 | 24.1 | 9.03 | 6 986 | 25.4 | 6.61 | 5 403 | 59.7 | 8.14 | 15 624 |
| Total South Africa underground | 77.7 | 9.31 | 23 242 | 83.4 | 9.25 | 24 808 | 155.2 | 7.07 | 35 262 | 316.3 | 8.19 | 83 312 |
South Africa surface | ||||||||||||
| Kraaipan Greenstone Belt | ||||||||||||
| Kalgold | 15.4 | 0.61 | 303 | 15.9 | 0.83 | 425 | 7.7 | 1.08 | 267 | 38.9 | 0.79 | 995 |
| Free State Region – surface | ||||||||||||
| Free State (Phoenix) | 95.3 | 0.29 | 873 | – | – | – | – | – | – | 95.3 | 0.29 | 873 |
| Free State (St Helena) | 258.7 | 0.27 | 2 227 | – | – | – | – | – | – | 258.7 | 0.27 | 2 227 |
| Free State (Other): | ||||||||||||
| – WRD | – | – | – | 3.9 | 0.51 | 65 | 28.2 | 0.45 | 408 | 32.1 | 0.46 | 473 |
| – Slimes dams | – | – | – | 660.2 | 0.22 | 4 708 | 15.5 | 0.19 | 94 | 675.6 | 0.22 | 4 802 |
| – Subtotal | – | – | – | 664.1 | 0.22 | 4 773 | 43.6 | 0.36 | 502 | 707.7 | 0.23 | 5 275 |
| Total Free State | 354.0 | 0.27 | 3 100 | 664.1 | 0.22 | 4 773 | 43.6 | 0.36 | 502 | 1 061.7 | 0.25 | 8 375 |
| Total Kalgold Tailings Dam | 22.0 | 0.27 | 191 | – | – | – | – | – | – | 22.0 | 0.27 | 191 |
| Total South Africa surface (incl Kalgold) | 391.3 | 0.29 | 3 594 | 680.0 | 0.24 | 5 198 | 51.3 | 0.47 | 769 | 1 122.6 | 0.26 | 9 561 |
| Total SA | 469.0 | 26 836 | 763.4 | 30 006 | 206.5 | 36 031 | 1 438.9 | 92 873 | ||||
Papua New Guinea1 | ||||||||||||
| Hidden Valley | 1.1 | 1.14 | 40 | 46.6 | 1.57 | 2 360 | 2.7 | 1.22 | 107 | 50.4 | 1.55 | 2 507 |
| Hamata | 0.09 | 1.28 | 4 | 2.1 | 2.14 | 145 | 0.1 | 1.90 | 5 | 2.3 | 2.10 | 159 |
| Wafi | – | – | – | 56.7 | 1.72 | 3 146 | 11.3 | 1.30 | 475 | 68.1 | 1.65 | 3 621 |
| Golpu | – | – | – | 428.2 | 0.61 | 8 434 | 108.7 | 0.48 | 1 669 | 536.9 | 0.59 | 10 103 |
| Nambonga | – | – | – | – | – | – | 19.9 | 0.79 | 505 | 19.9 | 0.79 | 505 |
| Total Papua New Guinea | 1.2 | 1.15 | 44 | 533.7 | 0.82 | 14 085 | 142.8 | 0.60 | 2 761 | 677.6 | 0.78 | 16 890 |
| Grand total | 470.2 | 26 880 | 1 297.0 | 44 091 | 349.3 | 38 792 | 2 116.5 | 109 763 | ||||
GOLD EQUIVALENTS1 |
Measured resources | Indicated resources | Inferred resources | Total mineral resources | ||||
| Tonnes (Mt) |
Au eq (000oz) |
Tonnes (Mt) |
Au eq (000oz) |
Tonnes (Mt) |
Au eq (000kg) |
Tonnes (Mt) |
Au eq (000oz) |
|
|---|---|---|---|---|---|---|---|---|
| Silver | ||||||||
| Hidden Valley | 1.1 | 14 | 46.6 | 792 | 2.7 | 45 | 50.4 | 850 |
| Total | 1.1 | 14 | 46.6 | 792 | 2.7 | 45 | 50.4 | 850 |
| Copper | ||||||||
| Golpu | – | – | 428.2 | 19 521 | 108.7 | 3 416 | 536.9 | 22 937 |
| Nambonga | – | – | – | – | 19.9 | 204 | 19.9 | 204 |
| Total | – | – | 428.2 | 19 521 | 128.6 | 3 620 | 556.8 | 23 141 |
| Total silver and copper as gold equivalents | 1.1 | 14 | 474.8 | 20 313 | 131.3 | 3 665 | 607.3 | 23 991 |
| Total Papua New Guinea including gold equivalents | 1.2 | 58 | 533.7 | 34 398 | 142.8 | 6 426 | 677.6 | 40 881 |
| Total Harmony including equivalents | 470.2 | 26 894 | 1 297.0 | 64 404 | 349.3 | 42 457 | 2 116.5 | 133 754 |
OTHER METALS |
Measured resources | Indicated resources | Inferred resources | Total mineral resources | ||||||||
| Tonnes (Mt) |
Grade (g/t) |
Ag (000oz) |
Tonnes (Mt) |
Grade (g/t) |
Ag (000oz) |
Tonnes (Mt) |
Grade (g/t) |
Ag (000oz) |
Tonnes (Mt) |
Grade (g/t) |
Ag (000oz) |
|
|---|---|---|---|---|---|---|---|---|---|---|---|---|
Papua New Guinea1 | ||||||||||||
| Silver | ||||||||||||
| Hidden Valley | 1.1 | 21.51 | 750 | 46.6 | 29.60 | 44 371 | 2.7 | 28.50 | 2 449 | 50.4 | 29.37 | 47 613 |
| Golpu | – | – | – | 428.2 | 1.14 | 15 664 | 108.7 | 0.88 | 3 090 | 536.9 | 1.09 | 18 754 |
| Nambonga | – | – | – | – | – | – | 19.9 | 2.87 | 1 836 | 19.9 | 2.87 | 1 836 |
| Total | 1.1 | 21.51 | 750 | 474.8 | 3.93 | 60 035 | 131.3 | 1.76 | 7 418 | 607.3 | 3.49 | 68 203 |
| Measured resources | Indicated resources | Inferred resources | Total mineral resources | |||||||||
| Tonnes (Mt) |
Grade (%) |
Cu (Mlb) |
Tonnes (Mt) |
Grade (%) |
Cu (Mlb) |
Tonnes (Mt) |
Grade (%) |
Cu (Mlb) |
Tonnes (Mt) |
Grade (%) |
Cu (Mlb) |
|
|---|---|---|---|---|---|---|---|---|---|---|---|---|
| Copper | ||||||||||||
| Golpu | – | – | – | 428.2 | 0.93 | 8 809 | 108.7 | 0.64 | 1 544 | 536.9 | 0.87 | 10 353 |
| Nambonga | – | – | – | – | – | – | 19.9 | 0.21 | 42 | 19.9 | 0.21 | 42 |
| Total | – | – | – | 474.8 | 0.93 | 8 809 | 128.6 | 0.58 | 1 636 | 556.8 | 0.85 | 10 445 |
| Measured resources | Indicated resources | Inferred resources | Total mineral resources | |||||||||
| Tonnes (Mt) |
Grade (ppm) |
Mo (Mlb) |
Tonnes (Mt) |
Grade (ppm) |
Mo (Mlb) |
Tonnes (Mt) |
Grade (ppm) |
Mo (Mlb) |
Tonnes (Mt) |
Grade (ppm) |
Mo (Mlb) |
|
|---|---|---|---|---|---|---|---|---|---|---|---|---|
| Molybdenum | ||||||||||||
| Golpu | – | – | – | 428.2 | 98.32 | 93 | 108.7 | 76.15 | 18 | 536.9 | 93.83 | 111 |
| Measured resources | Indicated resources | Inferred resources | Total mineral resources | |||||||||
| Tonnes (Mt) |
Grade (kg/t) |
U308 (Mlb) |
Tonnes (Mt) |
Grade (kg/t) |
U308 (Mlb) |
Tonnes (Mt) |
Grade (kg/t) |
U308 (Mlb) |
Tonnes (Mt) |
Grade (kg/t) |
U308 (Mlb) |
|
|---|---|---|---|---|---|---|---|---|---|---|---|---|
South Africa | ||||||||||||
| Uranium | ||||||||||||
| Free State underground | ||||||||||||
| Masimong | – | – | – | 6.7 | 0.29 | 4 | 61.4 | 0.16 | 21 | 68.1 | 0.17 | 25 |
| Tshepong | 6.4 | 0.19 | 3 | 14.0 | 0.23 | 7 | 10.5 | 0.12 | 3 | 30.9 | 0.18 | 12 |
| Phakisa | 7.0 | 0.17 | 3 | 13.9 | 0.17 | 5 | 27.6 | 0.14 | 8 | 48.5 | 0.15 | 16 |
| Total | 13.4 | 0.18 | 5 | 34.6 | 0.22 | 16 | 99.5 | 0.15 | 32 | 147.5 | 0.17 | 54 |
| Total South Africa underground | 13.4 | 0.18 | 5 | 34.6 | 0.22 | 16 | 99.5 | 0.15 | 32 | 147.5 | 0.17 | 54 |
| Free State surface | – | – | – | 319.4 | 0.08 | 56 | – | – | – | 319.4 | 0.08 | 56 |
| Grand total | 13.4 | 0.18 | 2 | 354.0 | 0.09 | 72 | 99.5 | 0.15 | 32 | 466.9 | 0.11 | 110 |
- 1 Total attributable gold equivalent ounces are calculated assuming a US$1 400/oz Au, US$3.10/lb Cu and US$23.00/oz Ag with 100% recovery for all metals
- NB Rounding of numbers may result in slight computational discrepancies
- Note: 1 ton = 907 kg = 2 000 lbs
- 1 troy ounce = 32.1507 grams
- Au = gold
- Ag = silver
- Cu = copper
- U308 = uranium
- Mo = molybdenum
Mineral reserves statement
GOLD | Proved reserves | Probable reserves | Total mineral reserves | ||||||
| Tonnes (Mt) |
Grade (g/t) |
Gold 2 (000oz) |
Tonnes (Mt) |
Grade (g/t) |
Gold 2 (000oz) |
Tonnes (Mt) |
Grade (g/t) |
Gold 2 (000oz) |
|
|---|---|---|---|---|---|---|---|---|---|
South Africa underground |
|||||||||
| Free State | |||||||||
| Gold | |||||||||
| Bambanani | 1.9 | 10.33 | 647 | – | – | – | 1.9 | 10.33 | 647 |
| Joel | 2.4 | 5.26 | 403 | 4.4 | 5.87 | 822 | 6.7 | 5.66 | 1 225 |
| Masimong | 4.9 | 4.48 | 710 | 1.7 | 4.40 | 237 | 6.6 | 4.46 | 947 |
| Phakisa | 3.5 | 6.15 | 701 | 4.0 | 7.68 | 993 | 7.6 | 6.97 | 1 694 |
| Target 1 | 5.0 | 4.21 | 672 | 5.8 | 5.42 | 1 008 | 10.7 | 4.86 | 1 680 |
| Target 3 | 2.5 | 5.98 | 471 | 4.2 | 5.04 | 684 | 6.7 | 5.38 | 1 155 |
| Tshepong | 20.5 | 5.57 | 3 676 | 2.4 | 5.33 | 419 | 23.0 | 5.54 | 4 095 |
| Unisel | 1.6 | 4.29 | 223 | 0.7 | 4.02 | 84 | 2.3 | 4.21 | 307 |
| Total Free State underground | 42.4 | 5.51 | 7 503 | 23.2 | 5.70 | 4 247 | 65.5 | 5.58 | 11 750 |
| West Rand | |||||||||
| Doornkop | |||||||||
| Doornkop South Reef | 2.6 | 5.03 | 420 | 5.0 | 5.59 | 899 | 7.6 | 5.40 | 1 319 |
| Kusasalethu | 9.4 | 6.80 | 2 055 | 26.2 | 5.66 | 4 778 | 35.6 | 5.96 | 6 833 |
| Total West Rand | 12.0 | 6.42 | 2 475 | 31.2 | 5.65 | 5 677 | 43.2 | 5.86 | 8 152 |
| Total South Africa underground | 54.4 | 5.71 | 9 978 | 54.4 | 5.67 | 9 924 | 108.8 | 5.69 | 19 902 |
South Africa surface |
|||||||||
| Kraaipan Greenstone Belt | |||||||||
| Kalgold | 7.0 | 0.90 | 203 | 10.4 | 1.02 | 341 | 17.5 | 0.97 | 544 |
| Free State – surface | |||||||||
| Free State (Phoenix) | 95.3 | 0.29 | 873 | – | – | – | 95.3 | 0.29 | 873 |
| Free State (St Helena) | 258.7 | 0.27 | 2 227 | – | – | – | 258.7 | 0.27 | 2 227 |
| Free State (Other):– WRD | – | – | – | 3.9 | 0.51 | 65 | 3.9 | 0.51 | 65 |
| – Slimes dams | – | – | – | 594.3 | 0.23 | 4 333 | 594.3 | 0.23 | 4 333 |
| – Subtotal | – | – | – | 598.2 | 0.23 | 4 398 | 598.2 | 0.23 | 4 398 |
| Total Free State | 354.0 | 0.27 | 3 100 | 598.2 | 0.23 | 4 398 | 952.2 | 0.24 | 7 498 |
| Total South Africa surface (incl Kalgold) | 361.0 | 0.28 | 3 303 | 608.7 | 0.24 | 4 739 | 969.7 | 0.26 | 8 042 |
| Total South Africa | 415.4 | 13 281 | 663.1 | 14 663 | 1 078.4 | 27 944 | |||
Papua New Guinea ¹ |
|||||||||
| Hidden Valley | 1.1 | 1.14 | 40 | 25.4 | 1.75 | 1 430 | 26.5 | 1.72 | 1 430 |
| Hamata | 0.03 | 1.10 | 1 | 1.6 | 2.26 | 117 | 1.6 | 2.24 | 118 |
| Golpu | – | – | – | 225.0 | 0.86 | 6 194 | 225.0 | 0.86 | 6 194 |
| Total Papua New Guinea | 1.1 | 1.14 | 41 | 252.1 | 0.96 | 7 741 | 253.2 | 0.96 | 7 782 |
| Grand total | 416.5 | 13 322 | 915.1 | 1 331.6 | 22 404 | 1 331.6 | 35 726 | ||
- 1 Total attributable gold equivalent ounces are calculated assuming a US$1 400/oz Au, US$3.10/lb Cu and US$23.00/oz Ag with 100% recovery for all metals
- 2 Metal figures are fully inclusive of all mining dilutions and gold losses, and are reported as mill delivered tonnes and head grades
Metallurgical recovery factors have not been applied to the reserve figures
- NB Rounding of numbers may result in slight computational discrepancies
- Note: 1 ton = 907 kg = 2 000 lbs
- 1 troy ounce = 32.1507 grams
GOLD EQUIVALENTS1 |
Proved reserves | Probable reserves | Total mineral reserves | |||
| Tonnes (Mt) |
Au eq2 (000oz) |
Tonnes (Mt) |
Au eq2 (000oz) |
Tonnes (Mt) |
Au eq2 (000oz) |
|
|---|---|---|---|---|---|---|
| Silver | ||||||
| Hidden Valley | 1.1 | 11 | 25.4 | 456 | 26.5 | 467 |
| Total | 1.1 | 11 | 25.4 | 456 | 26.5 | 467 |
| Copper | ||||||
| Golpu | – | – | 225.0 | 13 265 | 225.0 | 13 265 |
| Total | – | – | 225.0 | 13 265 | 225.0 | 13 265 |
| Total silver and copper as gold equivalents | 1.1 | 11 | 250.4 | 13 720 | 251.5 | 13 731 |
| Total Papua New Guinea including gold equivalents | 1.1 | 52 | 252.1 | 21 461 | 253.2 | 21 513 |
| Total Harmony including gold equivalents | 416.5 | 13 333 | 915.1 | 36 124 | 1 331.6 | 49 457 |
OTHER METALS |
Proved reserves | Probable reserves | Total mineral reserves | ||||||
| Tonnes (Mt) |
Grade (g/t) |
Ag2 (000oz) |
Tonnes (Mt) |
Grade (g/t) |
Ag2 (000oz) |
Tonnes (Mt) |
Grade (g/t) |
Ag2 (000oz) |
|
|---|---|---|---|---|---|---|---|---|---|
Papua New Guinea1 |
|||||||||
| Silver | |||||||||
| Hidden Valley | 1.1 | 18.99 | 662 | 25.4 | 33.11 | 27 080 | 26.5 | 32.53 | 27 742 |
| Golpu | – | – | – | 225.0 | 1.36 | 9 864 | 225.0 | 1.36 | 9 864 |
| Total | 1.1 | 18.99 | 662 | 250.4 | 4.59 | 36 944 | 251.5 | 4.65 | 37 606 |
| Tonnes (Mt) |
Grade (%) |
Cu2 (Mlb) |
Tonnes (Mt) |
Grade (%) |
Cu2 (Mlb) |
Tonnes (Mt) |
Grade (%) |
Cu2 (Mlb) |
|
|---|---|---|---|---|---|---|---|---|---|
| Copper | |||||||||
| Golpu | – | – | – | 225.0 | 1.21 | 5 992 | 225.0 | 1.21 | 5 992 |
| Tonnes (Mt) |
Grade (ppm) |
Mo2 (Mlb) |
Tonnes (Mt) |
Grade (ppm) |
Mo2 (Mlb) |
Tonnes (Mt) |
Grade (ppm) |
Mo2 (Mlb) |
|
|---|---|---|---|---|---|---|---|---|---|
| Molybdenum | |||||||||
| Golpu | – | – | – | 225.0 | 81 | 40 | 225.0 | 81 | 40 |
- 1 Total attributable gold equivalent ounces are calculated assuming a US$1 400/oz Au, US$3.10/lb Cu and US$23.00/oz Ag with 100% recovery for all metals
- 2 Metal figures are fully inclusive of all mining dilutions and gold losses, and are reported as mill delivered tonnes and head grades
Metallurgical recovery factors have not been applied to the reserve figures
- NB Rounding of numbers may result in slight computational discrepancies
- Note: 1 ton = 907 kg = 2 000 lbs
- 1 troy ounce = 32.1507 grams
- Au = gold
- Ag = silver
- Cu = copper
- U308 = uranium
- Mo = molybdenum